Tokyo Metro set the IPO price range at 1,100 to 1,200 Yen per share. At the top end of the range, Tokyo Metro would raise 349 billion yen ($2.35 billion).
Our base case valuation of Tokyo Metro is implied target price of 1,178 yen per share. This is within the top end of the IPO price range (1,200 yen).
Given the lack of upside relative to the IPO price range, we have a Negative view of this IPO.
Tokyo Metro (9023 JP) set the IPO price range at 1,100 to 1,200 Yen per share. At the top end of the range,Tokyo Metro would raise 349 billion yen ($2.35 billion). The final IPO price will be determined on 15 October and its shares will be listed on the Tokyo Stock Exchange on 23 October. The Japanese government plans to use the IPO proceeds to repay bonds issued after the 2011 earthquake and tsunami.
Tokyo Metro IPO Valuation Analysis
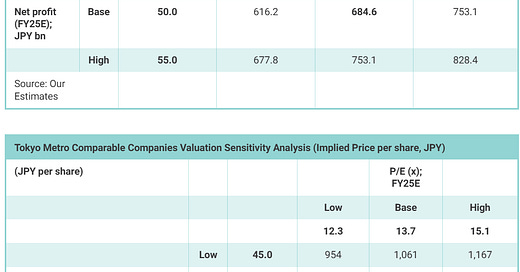
Our base case valuation of Tokyo Metro is implied market cap of 685 billion yen suggesting implied target price of 1,178 yen per share. This is within the top end of the IPO price range (1,200 yen).
Given the lack of upside relative to the IPO price range, we have a Negative view of this IPO. Our valuation sensitivity analysis suggests an implied market cap range of 555 billion yen to 828 billion yen (954 yen per share to 1,426 yen per share).
Our base case valuation is based on FY25E P/E of 13.7x our estimated net profit of 50 billion yen in FY25E. The target P/E of 13.7x is based on the average P/E of the comps. To value Tokyo Metro, we used four comps including Central Japan Railway (9022 JP), East Japan Railway Co (9020 JP), West Japan Railway Co (9021 JP), and Tokyu Corp (9005 JP).
In the past couple of years, Tokyo Metro generated higher profit margins than its peers. For example, Tokyo Metro's EBITDA margins averaged 33.5% in FY23 and FY24 versus the comps' average EBITDA margins of 26% in the same period.
However, the comps had higher sales growth than Tokyo Metro in the past two years. The comps had average annual sales growth of 22.1% in FY23 and FY24 versus Tokyo Metro which had average annual sales growth of 12.6% in the same period.
Keep reading with a 7-day free trial
Subscribe to Douglas Research Insights to keep reading this post and get 7 days of free access to the full post archives.


